

The connected models behind The Diligence Stack.
The AI industry runs on a chain of dependencies most forecasts treat separately. We model it as one connected system. Nineteen models share a single demand framework, covering the full economic stack: semiconductor fabrication capacity, compute infrastructure, data center power, token economics, AI factory unit economics, and end-market revenue, from frontier labs down to enterprise deployment.
The CS Forecast Stack is the backbone of the research we publish here. When a Diligence Stack report makes a call on memory, power, server CPUs or enterprise spend, the work behind it comes from these models, and the models have to agree with each other before anything ships.
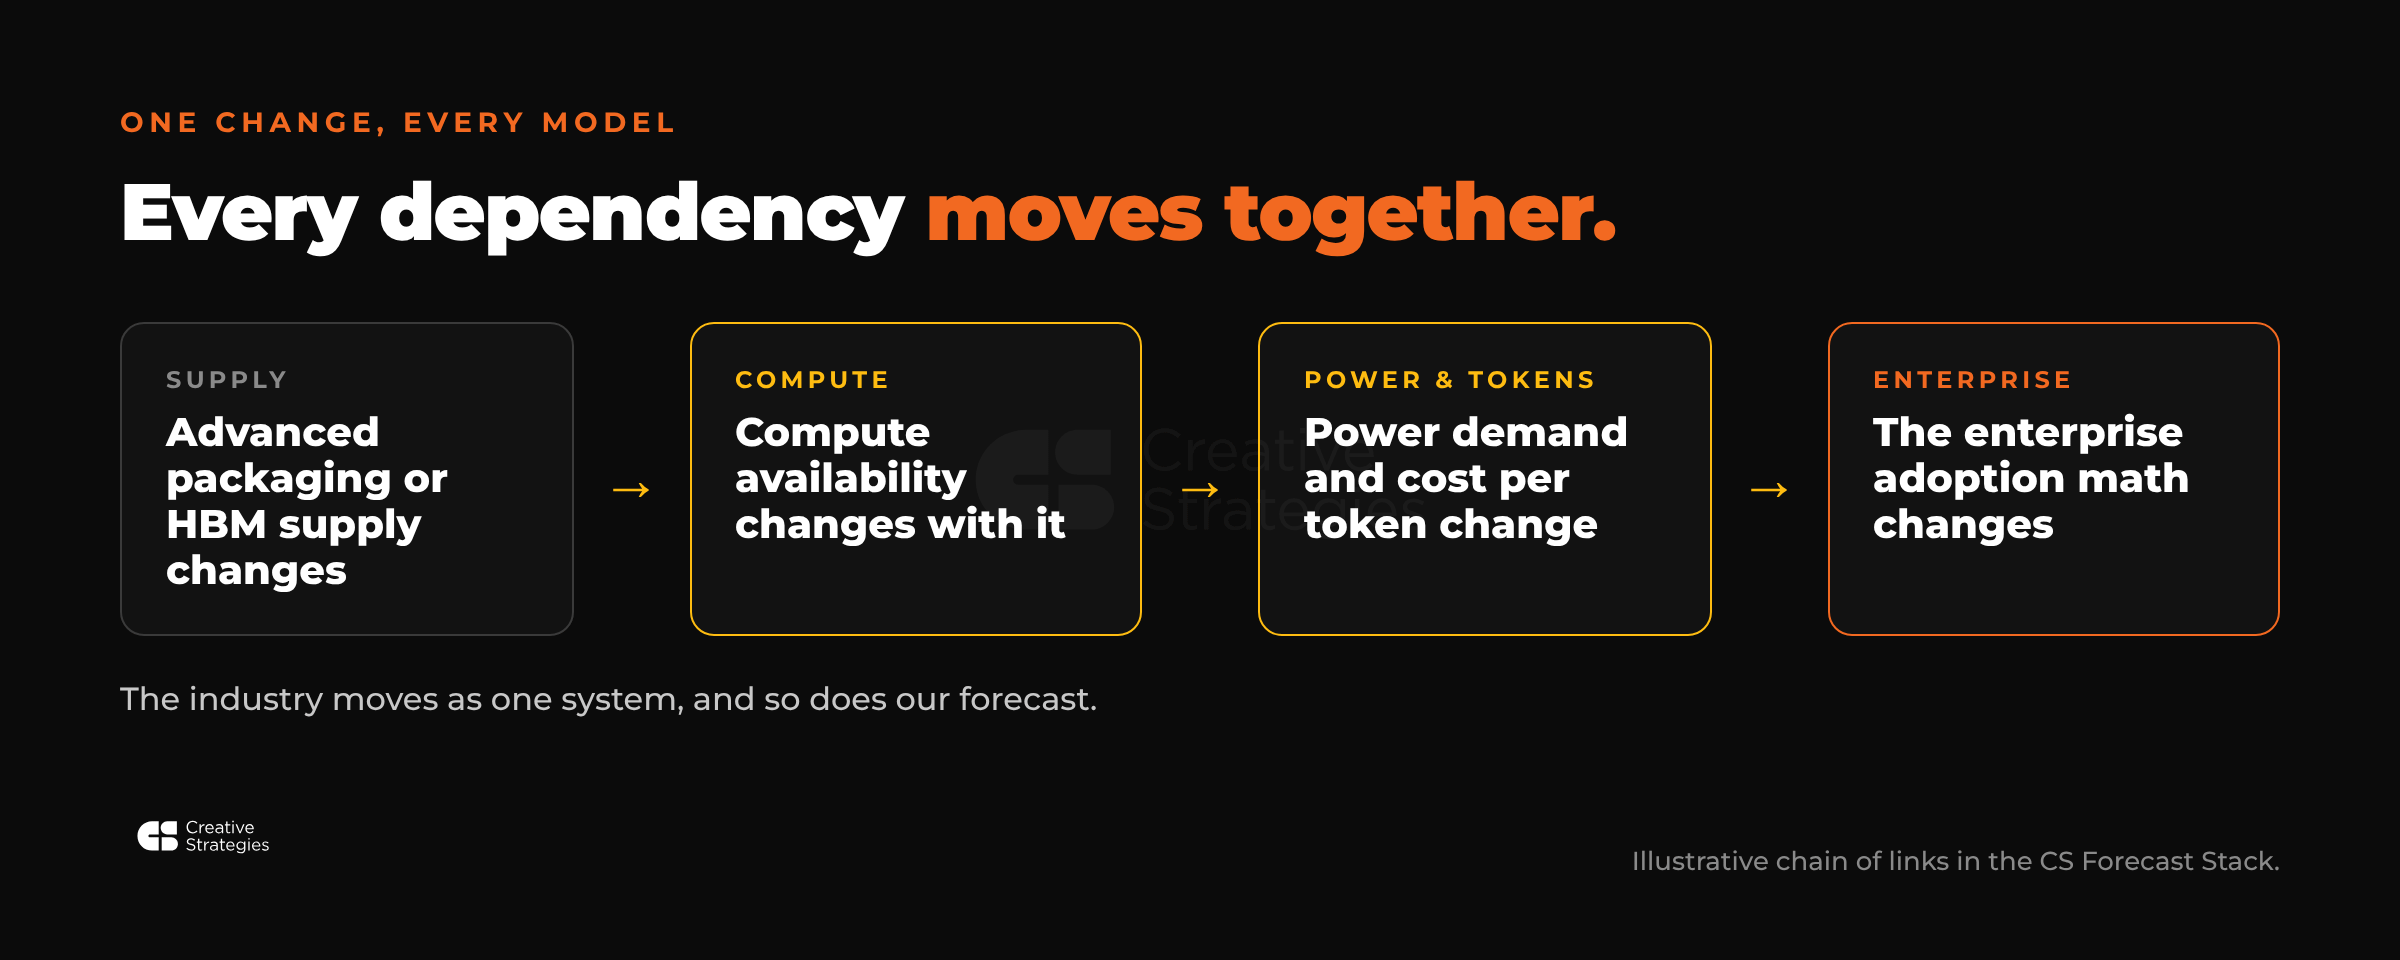
Every dependency moves together
When advanced packaging or HBM supply changes, compute availability changes with it. When compute changes, power demand and cost per token change. When cost per token changes, the enterprise adoption math changes. The industry moves as one system, and so does our forecast.
Someone holding one model sees either the cause or the effect. The stack shows both.
How the reports and the models work together
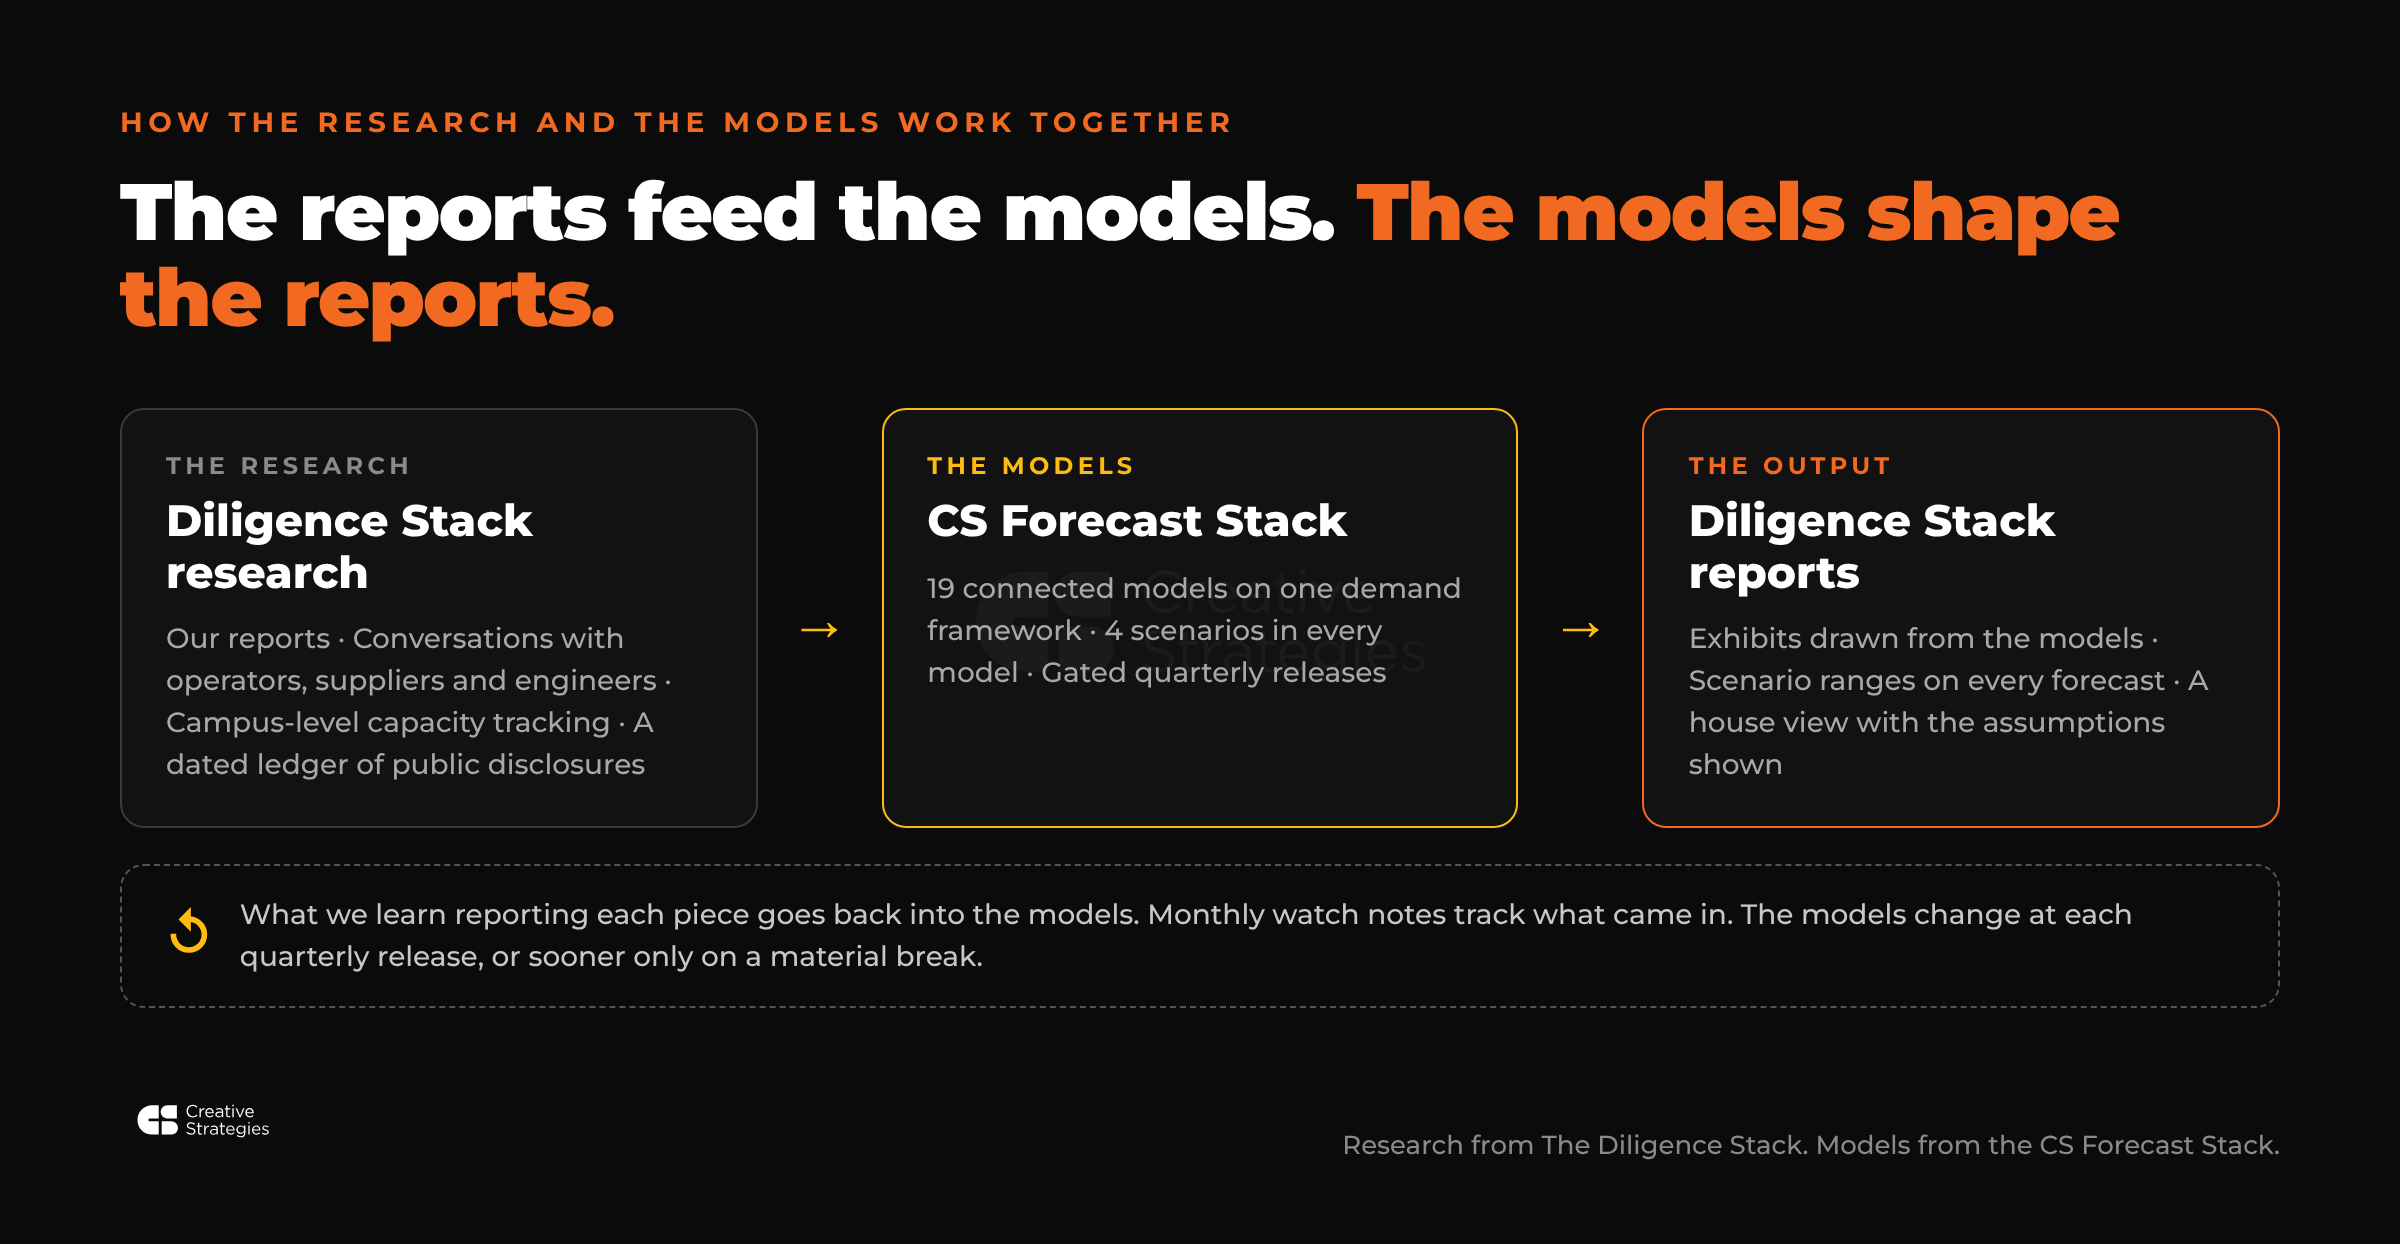
The research comes first. Every model starts from the work we do for The Diligence Stack: the reports themselves, conversations with the operators, suppliers and engineers building this infrastructure, campus-level capacity tracking, and a dated ledger of public company disclosures. We use third-party data to check our work. The house view is ours, with the assumptions shown.
That research sets the assumptions in the models, and the models give the reports their structure. When we write about a softer PC market freeing up wafers for data center compute, or whether the power ceiling binds before the chips do, we are reading the answer across several models at once. Our exhibits come from the same workbooks, and we show scenario ranges so you can see how much rides on each assumption.
It runs in both directions. What we learn reporting a piece goes back into the models. Monthly watch notes track what came in and which way it leans, and the models change at each quarterly release, or sooner when something material breaks.
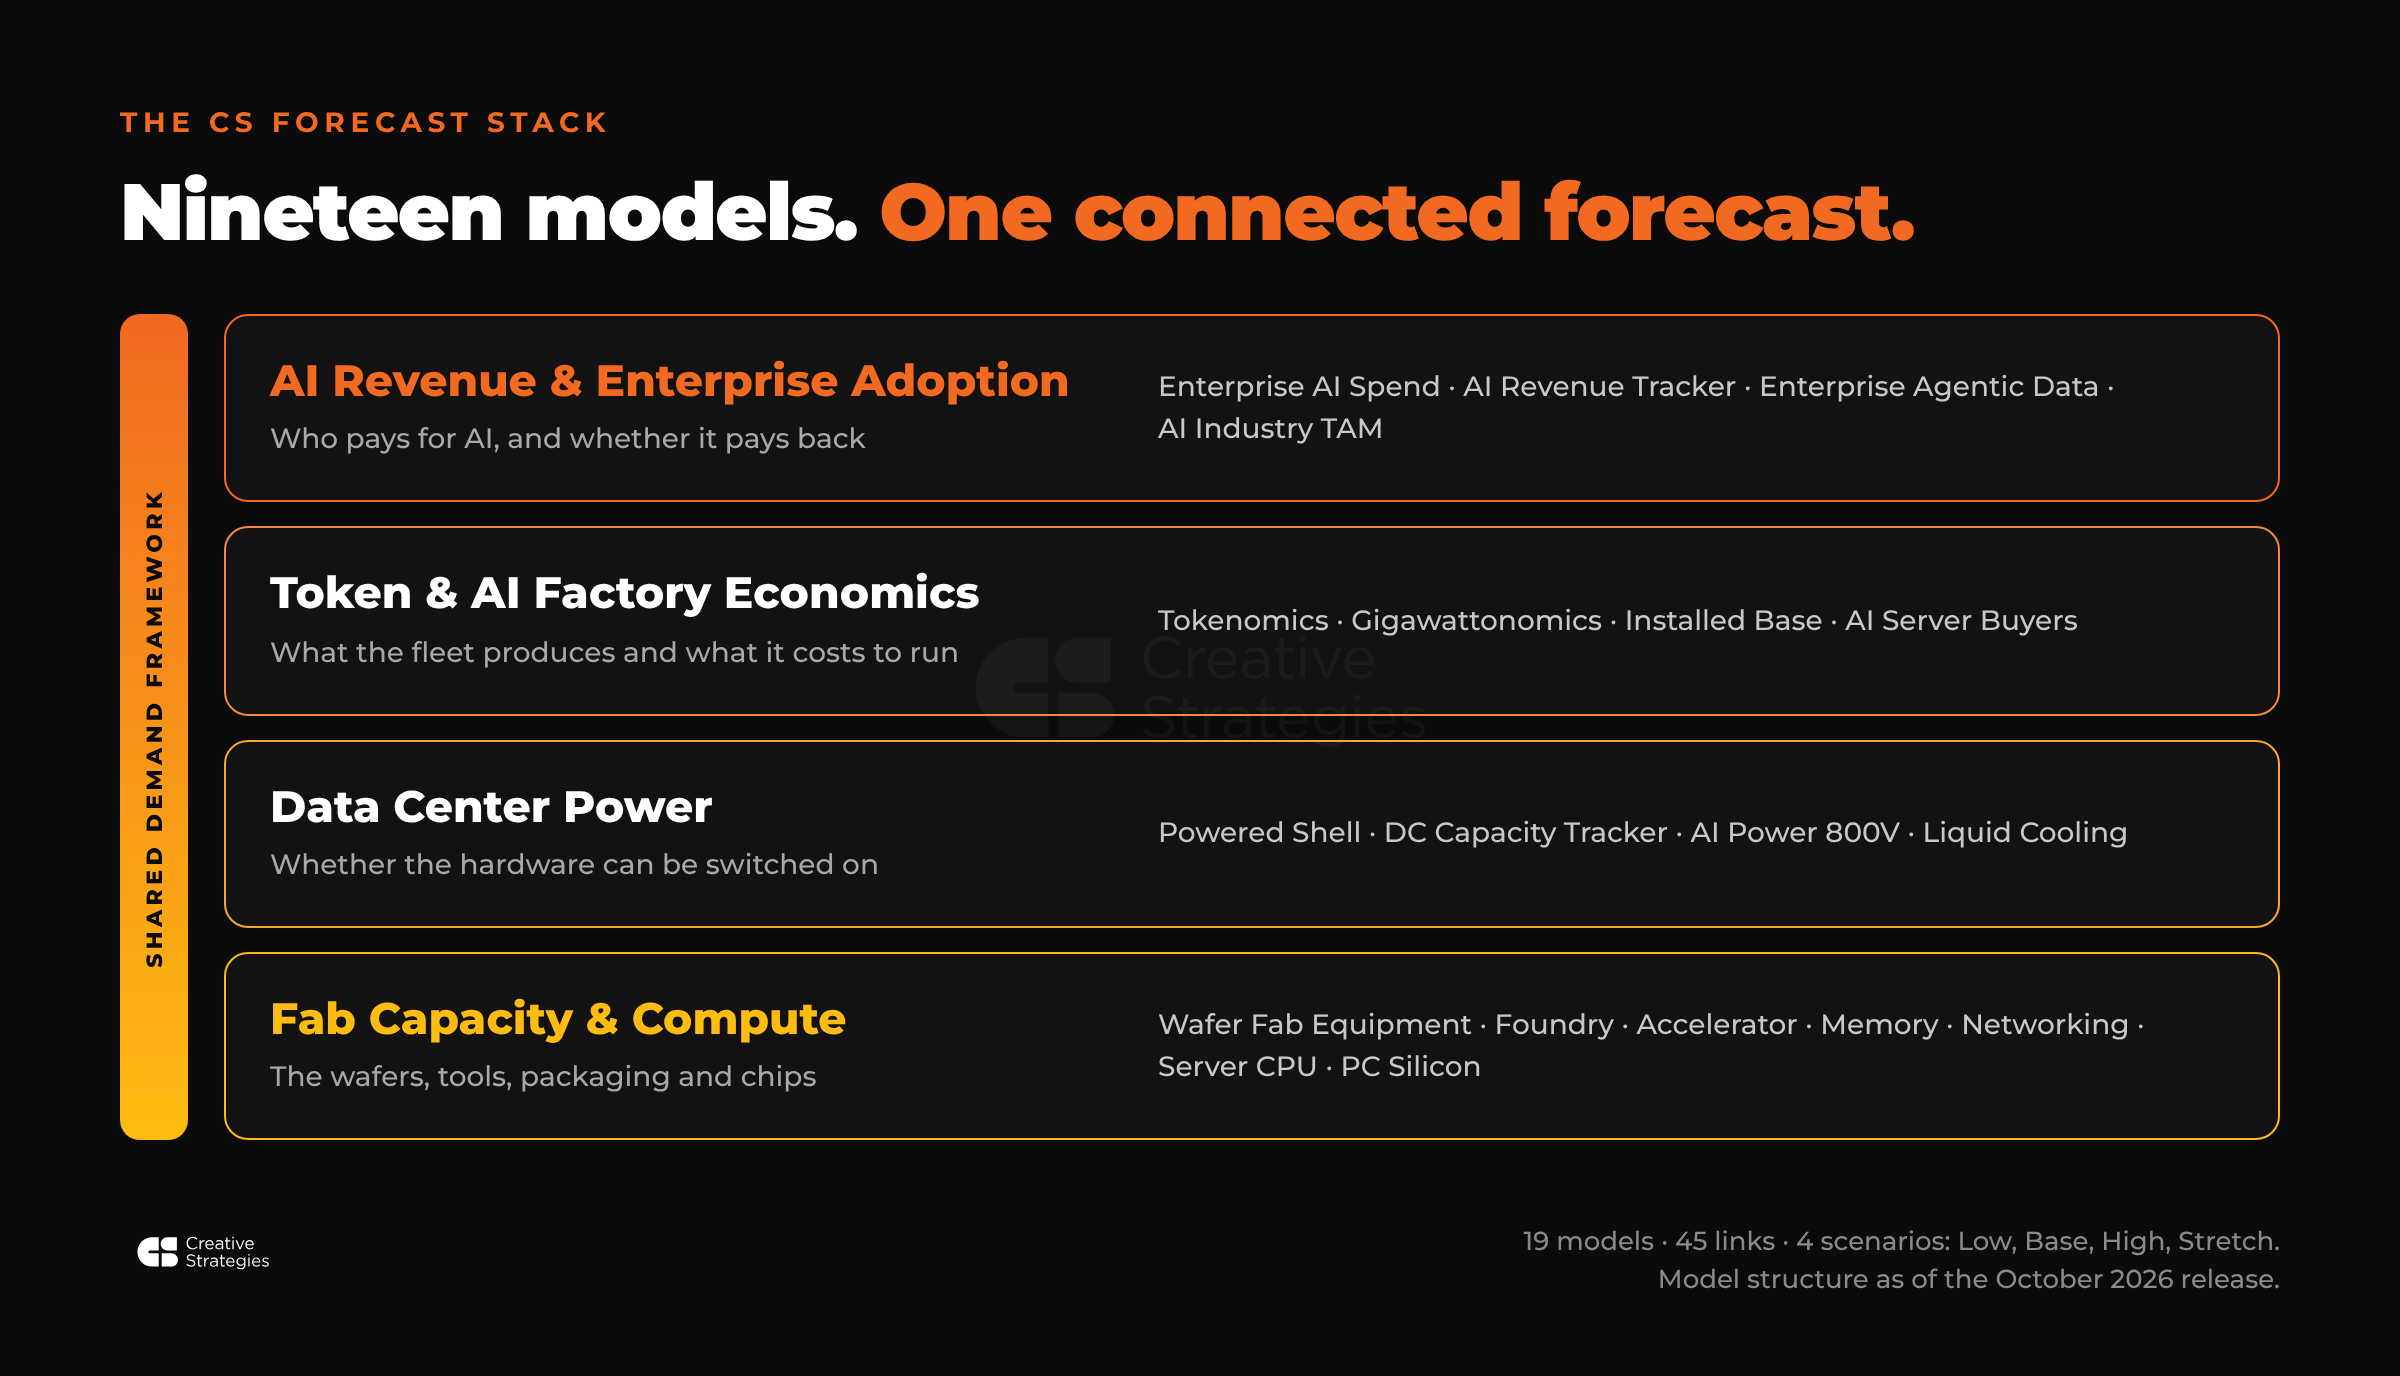
The four layers
AI Revenue & Enterprise Adoption. Who pays for AI, and whether it pays back. This layer covers enterprise AI spend, the AI Revenue Tracker that follows the money from the frontier labs to the clouds and the applications on top, what companies spend to make their data ready for agents, and the AI industry TAM.
Token & AI Factory Economics. What the fleet produces and what it costs to run: token demand and agent workloads, revenue and tokens per watt, the installed base of accelerators in service, and who is buying the servers.
Data Center Power. Whether the hardware can be switched on: the power the fleet needs against the power that can be delivered, campus-level capacity tracking, and the power delivery and cooling content per megawatt as racks get denser.
Fab Capacity & Compute. The wafers, tools, packaging and chips the build-out runs on: equipment, foundry, accelerators, memory, networking, server CPUs and PC silicon.
Questions the stack helps us answer
Where does the power ceiling bind first, and how much compute is waiting for power?
How much of accelerator value is HBM, and when does memory supply bind?
How large does the server CPU market get once agents need their own racks?
What does a gigawatt of AI capacity earn, and what does it cost to produce a token?
Can the frontier labs fund the capacity they have contracted?
How much are enterprises spending on AI, and how much of it is new budget?
Going deeper
Paid subscribers get the full reports and the exhibits built on the stack. Atlas subscribers can explore the models directly through dashboards and the Atlas research agent, which answers questions from the same models and the research behind them. If your team wants the workbooks themselves, get in touch.
[Button: Subscribe][Button: Explore Atlas][Button: Talk to us]
Model structure updated quarterly with full change log and analysis of the market changes. Forecast values are available to subscribers as shared in published reports.