

Where AI Constraints Become Pricing Leverage
Mapping Margin Quality Beneath the AI Infrastructure Constraint Stack

This is part 2 of our series on the semiconductor industry constraints. Part 1 below:

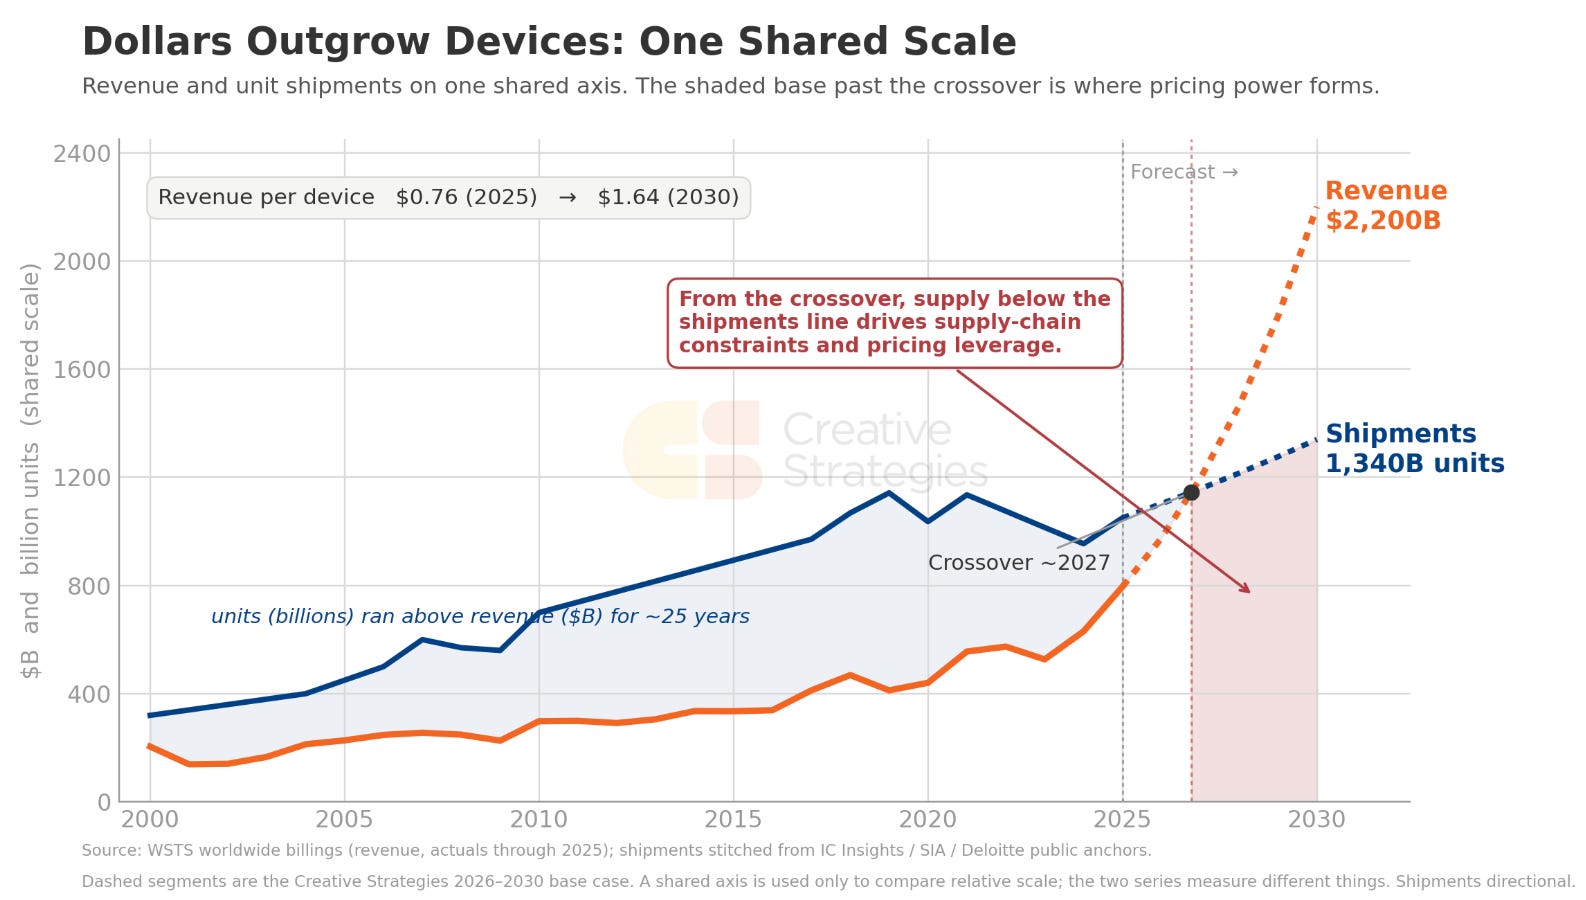
For most of the last twenty-five years, unit shipments ran well ahead of industry revenue. The industry scaled unit shipments faster than dollars. Then AI hit.
The chart below shows this shift in action. Semiconductor revenue is moving toward a much steeper path than unit shipments, which means more of the growth is coming through ASP, mix, complexity, and supply-chain scarcity rather than device volume alone. That spread is what we refer to as the pricing-leverage zone.
The underlying semiconductor supply chain is not (can not) scaling at the same pace as AI demand. From 2025 to 2030, semiconductor industry revenue grows roughly 22%–24% per year, while unit shipments grow roughly 5% per year. Revenue is growing about 4–5x faster than units. Every part of the supply chain ecosystem from the obvious things like HBM, advanced packaging, substrates, board materials, power analog, passives, test, metrology, and specialty materials all have to scale together. When the unit base cannot expand fast enough, the constrained layers below the shipment line capture more economics.
This report maps where that happens. Our first report showed where AI capacity slips. This report shows where those same constraints become margin expansion across the semiconductor supply chain.
Our central argument is that margin quality depends on the constraint behind the price. Many suppliers can raise price in a cycle this tight. Fewer can convert those increases into durable margin, and the difference shows up in the evidence we are tracking. Durable pricing leverage forms where customers have limited alternatives, qualification cycles run long, and delay carries a direct deployment cost and risk to revenue. Those conditions push buyers into long-term agreements, prepayments, and reservation fees, and the result appears as financial flow-through in blended ASP and gross margin. Temporary tightness produces price action too, but through weaker channels: spot spikes, input-cost pass-through, utilization recovery, and restocking.
Applied across the supply chain, the framework concentrates the highest-quality pricing power in memory and HBM, advanced packaging and substrates, and the qualified high end of high-speed board materials. AI-rack power analog and server-grade passives grade as real but SKU-specific and architecture-dependent. Power discretes, mature-node foundry, commodity passives, and undifferentiated materials carry weaker margin signals — more cyclical, closer to pass-through, or dependent on utilization rather than pricing.
The map is built to be tracked regularly. Confirming evidence sits near the top of the evidence ladder: LTAs, prepayments, price floors, allocation, and gross-margin flow-through. Disconfirming evidence shows up in the areas we are tracking as well: capacity additions, China supply, spot rollover, shorter contract durations, and easing lead times.
What’s in the full report
A five-level pricing evidence ladder that grades every price move by how much confidence it deserves — from lead-time chatter to LTAs, prepayments, and gross-margin flow-through
Observed pricing trends by segment: a July 2026 baseline of triangulated price ranges across the chain — memory contract moves, substrate and CCL increases, analog catalog actions, MLCC spot, and foundry ASP — with direction graded for each
A constraint-intensity vs. margin-quality matrix covering eleven segments, separating durable pricing power from pass-through, restocking, and utilization recovery
The pricing leverage heat map: where price action is most likely to become durable margin across memory, packaging, board materials, power, passives, foundry, test, and materials
Segment-by-segment analysis with names to track, the pricing mechanism behind each, and the key signal that confirms or breaks it
A beneficiary map organized by how value is captured — structural price owners, mix beneficiaries, utilization recovery, pass-through, and cost absorbers
The negative-evidence file: where customer pushback, China capacity, spot rollover, and EV digestion cap pricing that looks stronger than it is
A confirmation/disconfirmation dashboard, anchored to the July baseline, to track every thesis as the cycle moves from capacity announcements to margin reality