


Every note we publish rests on more work than fits on the page: the models behind the forecasts, the scenario outputs, the assumptions and how confident we are in each, and the data behind every exhibit. Atlas, the Creative Strategies research portal, is where that work lives. Each major report now comes with a companion research packet in Atlas, and our research agent is built to work through it with you. You can test our assumptions against your own, rerun the analysis under different inputs, and get to the specific numbers that matter for your work, without waiting on a call.
If you have Atlas access, the companion packet for this note is live now. Open it, ask the agent your hardest questions, and push on the parts of the argument you find least convincing. That is what it is there for. If you would like access for yourself or your team, reach out to discuss.
Additional research coverage in CS Atlas:
Micron Q4 FY26: The Memory Cycle Is Carrying a Larger Bit Base
HPE Networking Day Takeaways on Open AI Infrastructure
Synopsys Investor Day Connects Agentic EDA to Commercial Value
We understand and appreciate how much the historical lens on memory is still influencing how the market is viewing the category. Seasoned investors have spent decades learning to value memory suppliers on where they sit in the price cycle, and for most of that history it was the right approach. We think it now understates what this industry earns through a full cycle driven by AI—the workload that changed it all. In it’s simplest form, memory revenue is bits times price. In the two decades of covering memory and with each cycle we have observed, price did the swinging and bit demand kept compounding underneath it, so the floor of any downturn comes down to two things: how many bits ship at the bottom, and what they sell for when they do. The first of those has changed quite a bit. Our Base case has the industry shipping about 2.5 times as many conventional DRAM bits in 2030 as it did in 2026. HBM, which was a negligible share of revenue in the 2019 trough, reaches close to two-fifths of sector revenue by 2030.
The way we think about it is that the cycle is the waves and the bits are the tide. Every downturn is measured against a shoreline, and the tide in memory is coming in faster than at any point we have seen. Our thesis, and what we have modeled, is that the TAM is still rising, that there will be real downturns along the way, and that those downturns will play out from a revenue base several times larger than anything the industry earned before 2025. We call this betting on bits instead of history. The approach accepts that memory, at least parts of it, stays cyclical, and the one question it asks is whether the bits keep coming. Our model says they do, simply because the workload demands it, and by the end of the decade they arrive faster than the suppliers can build for them.
What history does and does not show
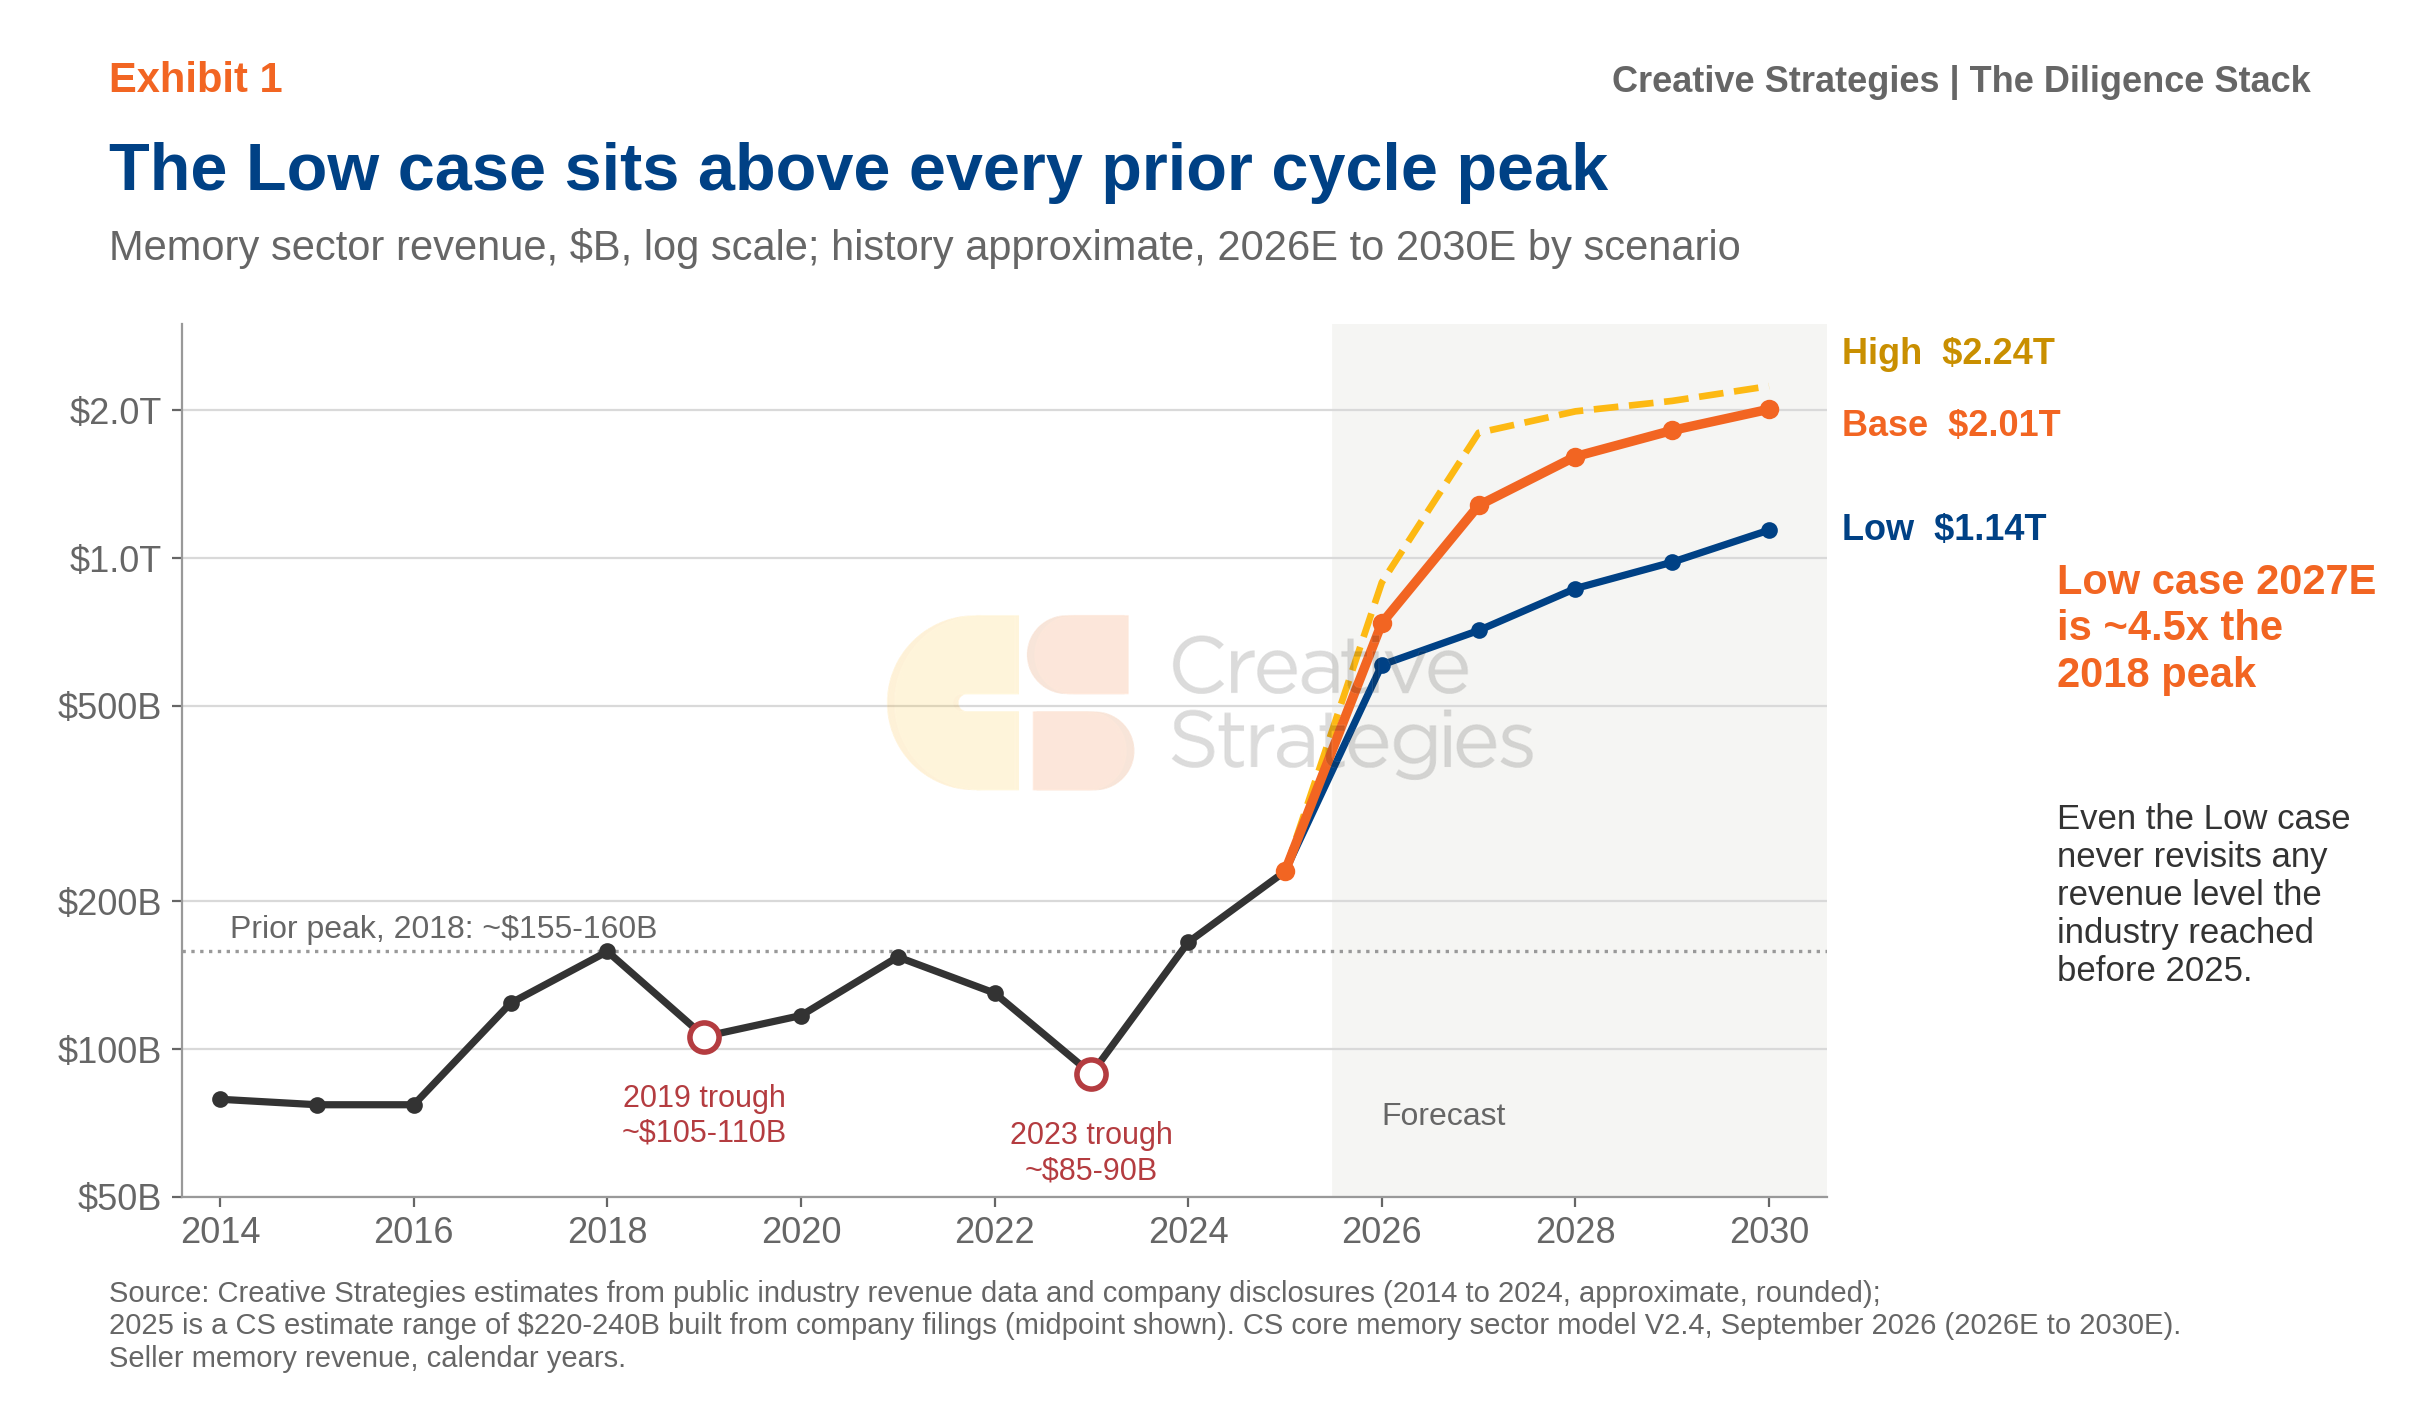
The usual argument for a higher floor points at the history and says each trough sits above the last one. The record does not cooperate, and any investor who knows the data will raise it early. By our estimates, memory revenue bottomed at $105 to $110 billion in 2019. After peaking at $150 to $155 billion in 2021, it fell to $85 to $90 billion in 2023, below the prior trough. The drawdowns were not gentle either, about one-third from 2018 to 2019 and close to 40% from the 2021 peak to the 2023 bottom.
That is a fair objection, and it is the reason we do not build this case on the revenue line. Revenue history blends two series that behave very differently. Bit demand grew through every one of those cycles. The damage came from realized pricing, which fell by about half in each downturn as new supply and customer inventory corrections landed at the same time. So a floor drawn from past revenue troughs inherits every accident of timing in that pricing. A floor drawn from bits asks something narrower. How much memory does the world need at the bottom of the next cycle, and what is the lowest price the suppliers have ever accepted for it?
Exhibit 1 puts the two regimes side by side on a log scale. Nothing the industry earned from 2014 through 2025 reaches our Low case in any forecast year, and that includes the 2018 peak of $155 to $160 billion. The Low case is where accelerator demand and pricing soften together, and even there 2027 revenue comes in near $712 billion, about 4.5 times that peak. We do not treat the Low case as a floor, and the floor itself comes in the next section. Even our downside case, in other words, lives in a different revenue regime from every cycle in the historical record.
Full Research Note for Subscribers
The trough-price floor: every bit in our 2026 to 2030 forecast priced at the worst realized prices of the last cycle, showing where the floor sits with pricing optimism taken out entirely
The downturn already in our Base case: the price cycle our forecast already carries, and why revenue holds through it
The supply balance: why the true shape of the TAM remains unobserved
What Micron’s latest print adds: the new evidence for the floor argument, and where it pushes back
What would break the view: the four conditions we are tracking
What it means for the suppliers: who the floor favors, and how investors should size it
The Atlas companion packet: rerun the floor with your own trough prices and bit paths, and take your questions to our research agent